
How to Build an AI Feature Prioritization System That Uses Real User Signals (Not Gut Feeling) in 2026
80% of software features shipped by SaaS teams are rarely or never used after launch. The number has held stubbornly close to that figure for over a decade, despite every advancement in product development tooling. At the same time, fixing a requirements defect discovered in production costs up to 1,500 times more than catching it in the planning phase. Most SaaS teams know these numbers. They still ship features nobody asked for.
Here is the paradox that makes this problem worse in 2026: AI-assisted development tools like Cursor, GitHub Copilot, and Claude Code have compressed the time from idea to deployed feature by 60 to 80%. Building is faster and cheaper than ever. But the 43% PMF failure rate caused by building the wrong thing has not moved in a decade. AI tooling lets teams build the wrong features faster, not smarter. The fix is not a better build process. It is an AI feature prioritization system that ensures what you build is what your users actually need, before a single sprint starts. This guide covers exactly how to build one.
Why Traditional Feature Prioritization Breaks Down at Scale#
Before building the system, it helps to understand precisely where the current approach fails. Most SaaS teams run prioritization through one of three broken patterns:
- Loudest customer wins: A high-ARR enterprise account requests a specific integration. The PM adds it to the top of the backlog because it risks a churned deal, even though 80% of the broader customer base needs something entirely different. The integration ships, the enterprise renews, but growth stalls because the feature meant nothing to acquisition.
- Internal compass drift: The founding team still designs for the user they imagined at launch, not the customer who is actually paying today. As the ICP evolves through early traction, the product roadmap lags by 6 to 12 months, invisibly.
- Competitor reaction: A competitor ships a feature that gets press coverage. It lands on the roadmap within the week. Six months of engineering capacity gets pulled into feature parity with a company targeting a different market segment.
- Survey overload: Quarterly NPS surveys and user research interviews generate dense qualitative reports that take weeks to synthesize and are outdated before they are finished. The insights are real; the lag makes them useless for sprint planning.
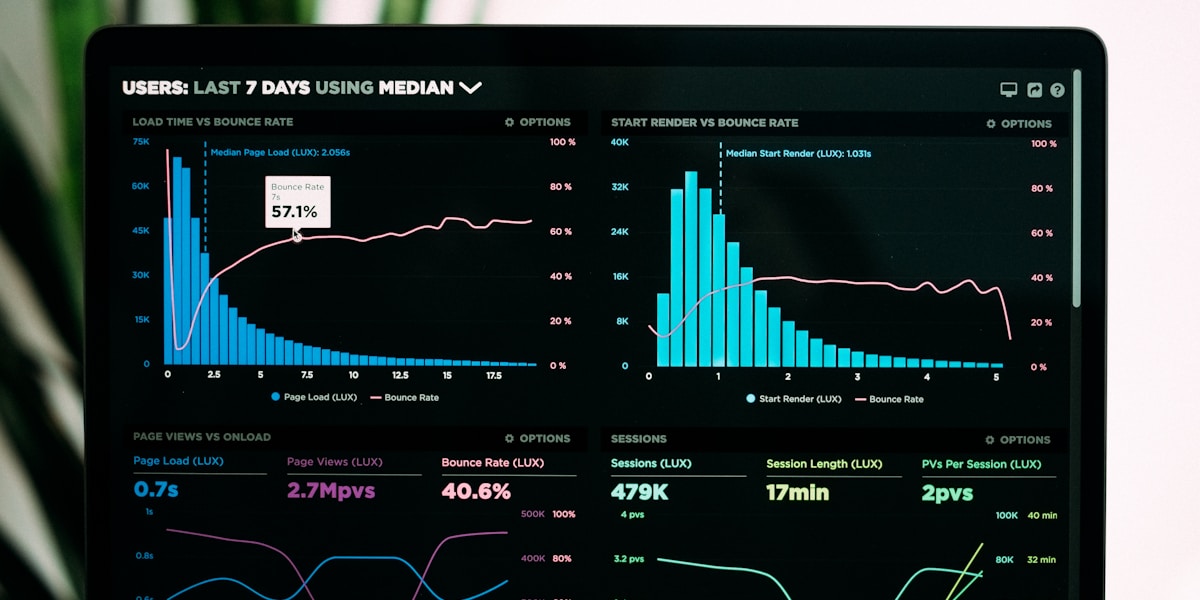
The fundamental problem is bandwidth. No product manager can read 2,000 support tickets, cross-reference session replay data, parse churn survey responses, and weight those inputs against revenue impact in a single sprint cycle. AI can do it continuously. The shift is from periodic, opinion-weighted prioritization to a living system that scores every potential feature against real behavioral and revenue data.
What an AI Feature Prioritization System Actually Looks Like#
At its core, an AI feature prioritization system is a pipeline with four layers: signal collection, AI analysis, weighted scoring, and roadmap output. Each layer feeds the next. The output is not a final roadmap but a ranked, scored list of candidate features with the reasoning behind each score surfaced for the team to review.
The system does not replace product judgment. It eliminates the information gap that forces product judgment to work on incomplete data. A PM who reviews a scored list of 40 features with supporting evidence from 1,800 user signals will make better decisions than one reviewing the same 40 features with three customer calls and their own intuition.
Layer 1: Signal Collection#
The system needs a unified input layer that pulls signals from every place users tell you what they need, directly or indirectly. For most SaaS products in 2026, those sources are:
- Support tickets and chat logs: Raw text from Intercom, Zendesk, or Freshdesk conversations. Users describe workarounds they are building, tasks they cannot complete, and friction points in their workflows. These are the most signal-dense source in any SaaS product.
- Feature request submissions: Canny, ProductBoard, or a custom intake form. Structured requests with vote counts and subscriber lists already contain partial prioritization signal.
- Product usage data: Event tracking from Mixpanel, Amplitude, or PostHog. Which features are used daily, which are used once and never touched, and where sessions consistently end before conversion.
- Churn survey responses: Exit surveys from churned accounts, whether captured through ChurnKey, a Typeform, or a CS exit interview. Churn reasons map directly to feature gaps.
- NPS and CSAT comments: The open-text fields from NPS surveys contain the most compressed signal in any feedback program. Detractor comments in particular name the product problems directly.
- Sales call transcripts: Lost deal analysis from Gong or Chorus surfaces features that are blocking conversion, which is a different and higher-stakes signal than what existing customers request.

Layer 2: AI Analysis#
Once signals are collected, the AI analysis layer processes them into structured feature signals. This is where language models do the heavy lifting. The analysis layer runs three jobs:
- Theme clustering: An LLM reads the raw text from all sources and groups signals by the underlying product need they describe. A support ticket about 'why can't I export to CSV' and a churn comment saying 'we left because our operations team needed to get data into Excel' are the same signal. The model identifies and groups them.
- Sentiment and urgency scoring: Not all mentions of the same feature gap carry the same weight. A user expressing frustration about a missing feature in a churn survey is a higher-urgency signal than a user casually requesting the same feature on a forum. The model scores urgency and emotional intensity for each signal.
- Revenue mapping: The analysis cross-references signal sources against customer records when possible. A feature gap mentioned exclusively by free users scores differently than the same gap mentioned by accounts representing 60% of ARR.
Layer 3: Weighted Scoring Model#
After the AI analysis layer produces structured signals, the scoring model calculates a Priority Score for each candidate feature. The formula is configurable but a strong default weighting for most B2B SaaS products looks like this:
- Revenue impact (35%): The ARR associated with accounts mentioning this gap, plus estimated ARR at risk from accounts flagging it in churn signals.
- Signal frequency (25%): How many unique accounts mentioned this gap across all sources, weighted by recency so signals from the last 30 days count more than signals from six months ago.
- Urgency score (20%): The average urgency and sentiment intensity score from the AI analysis layer across all signals for this feature.
- Strategic fit (20%): A human-set weight that reflects whether the feature aligns with the product's current growth stage, ICP definition, and the quarter's strategic priorities.
The goal is not to let the algorithm pick the roadmap. It is to give your product team the information they need to make better decisions in half the time. Judgment still belongs with the human. The AI removes the information bottleneck that forces that judgment to work on incomplete data.
Layer 4: Roadmap Output and Refresh Cycle#
The system outputs a weekly or bi-weekly Priority Report that surfaces the top-ranked feature candidates with supporting evidence. Each line item in the report shows the Priority Score, the sources that contributed to it, example verbatim signals, and the revenue at stake. The team reviews this in planning rather than starting from scratch.
The system refreshes continuously. New support tickets and usage data feed the signal collection layer in near real-time. The Priority Score for each feature updates as new evidence arrives. A feature that was ranked 12th last month can surface to position 3 this month if a cluster of churn signals appears around it.
Step-by-Step: Building the System in 2026#

Phase 1: Connect Your Signal Sources (Week 1)#
Start with your two highest-volume signal sources. For most SaaS products, that is the support platform (Intercom, Zendesk) and product analytics (Mixpanel, Amplitude, PostHog). Connect both via API to a central data store, either a Postgres database, a Google BigQuery project, or a vector database like Pinecone if you plan to run semantic search on the signal corpus.
Set up a daily sync job using an automation platform like Make or n8n, or write a simple Python script that pulls the previous day's signals and appends them to the central store. Tag each signal with its source, account ID, and timestamp. Do not over-engineer this layer. A flat table with five columns (signal text, source, account ID, timestamp, ARR tier) is sufficient for v1.
Phase 2: Build the AI Analysis Layer (Week 2)#
The analysis layer is a prompt-driven pipeline that processes batches of signals through an LLM. A weekly batch run on the previous seven days of signals works well for most teams. The pipeline has three sequential steps:
- Categorization prompt: Feed each signal through a classification prompt that asks the model to identify whether it references a specific product gap, a UX friction point, a missing integration, a performance issue, or general satisfaction. Discard signals that do not reference a product problem. This reduces noise by 40 to 60% on average.
- Feature extraction prompt: For signals that pass categorization, run an extraction prompt that identifies the underlying product need in a standardized format: 'User cannot [action] because [missing capability].' This produces a consistent sentence structure that enables clustering.
- Clustering and deduplication: Use embedding similarity (sentence transformers via the Anthropic or OpenAI embeddings API) to group extracted feature needs that describe the same underlying gap. Set a similarity threshold of 0.85 to 0.90 for grouping. Assign each cluster a human-readable label either manually or by running a summarization prompt on the cluster members.
Phase 3: Build the Scoring Model (Week 3)#
With clusters defined and tagged, the scoring model is mostly a SQL query or a Python calculation. For each feature cluster, calculate the four weighted score components (Revenue Impact, Signal Frequency, Urgency Score, Strategic Fit) and sum them into a single Priority Score on a 0-100 scale.
The Strategic Fit component is the only one that requires human input each cycle. Keep it simple: a PM rates each feature cluster 1-5 against the current quarter's focus areas. This takes 15 to 20 minutes per week and ensures the algorithm cannot surface features that are technically high-signal but strategically off-course.
Phase 4: Build the Report Output (Week 4)#
The final layer outputs the weekly Priority Report. This can be as simple as a Notion database auto-populated via the Notion API, a Google Sheet populated by a Python script, or a Slack digest summarizing the top five ranked features with their scores and supporting evidence. The format matters less than the consistency. Teams that receive the report in the same format every Monday at 9am adopt it into planning faster than teams who have to log into a tool to find it.
The Tools That Power This Stack in 2026#
A production-grade AI feature prioritization system typically combines five categories of tooling:
- Signal aggregation: Zapier, Make, or n8n for connecting source APIs. Segment or Rudderstack for streaming product analytics events without writing custom connectors.
- Data storage: Supabase (Postgres) for structured signal storage, Pinecone or Weaviate for semantic vector search on text signal corpora.
- AI analysis: Claude claude-sonnet-5 or Claude claude-opus-4-8 via the Anthropic API for the categorization, extraction, and clustering prompts. Anthropic's prompt caching feature reduces cost by 60 to 80% on repeated batch runs against the same signal corpus.
- Scoring and calculation: Python with pandas for the scoring model, or a simple SQL view in Supabase that recalculates scores each time new signals are added.
- Report delivery: Notion API, Google Sheets API, or a Slack webhook for automated report delivery. For teams using Linear or Jira, a custom integration that creates or updates roadmap items directly saves an additional manual step.

Three Mistakes That Undermine This System#
Teams that build this system and fail to get value from it usually make one of three mistakes:
- Treating the Priority Score as the decision: The score is input to a decision, not the decision itself. A feature ranked #1 by the algorithm might conflict with a strategic pivot that is not yet reflected in the data. PMs who skip the review step and ship the top-scored feature without judgment turn a decision-support system into an autonomous product manager, which is the wrong use case.
- Neglecting the signal quality layer: If the support platform is used heavily for billing questions, password resets, and login issues, those signals will overwhelm the product gap signals unless you filter them out at the collection stage. Define a taxonomy for what counts as a product signal before building the pipeline. Garbage in, garbage out applies to AI just as much as to traditional analytics.
- Running the system on a quarterly cadence: The value of this system comes from continuous signal ingestion and weekly updates. Teams that treat it as a quarterly exercise lose the recency weighting that makes churn-adjacent signals so powerful. A monthly or quarterly report is not meaningfully different from a traditional user research synthesis. Weekly is the minimum cadence for this to outperform gut-based prioritization.
How This Connects to the Build, Validate, Launch Framework#
At Infinity Sky AI, we build custom AI tools and SaaS products using a three-phase framework: Build, Validate, Launch. Feature prioritization sits squarely in the Validate phase. Knowing what to build before you build it is not a nice-to-have; it is the difference between a product that finds product-market fit in 18 months and one that spends three years adding features nobody cares about.
The AI feature prioritization system we have described here is the kind of operational infrastructure we help SaaS founders build as part of our custom AI development engagements. It is not a speculative future technology. Teams are running versions of this in 2026 on Anthropic's API, standard automation platforms, and their existing product analytics stack. The competitive advantage is not in having a novel tool; it is in having a systematic process that most competitors are still running with spreadsheets and opinion.
How many signal sources do I need to get started?
Will this system work if we only have 50 to 100 customers?
How do I handle signals from customers who are not in our target ICP?
How much does it cost to run this system?
Can we use this system to prioritize improvements to existing features rather than just new feature requests?
Ready to Build a Smarter Product Development System?#
An AI feature prioritization system is one of the highest-leverage infrastructure investments a SaaS team can make. It does not replace product instinct; it gives that instinct better information to work with. Teams that build this in 2026 will compound that advantage over time as the signal corpus grows and the scoring model becomes more calibrated to their specific customer base.
If you are building a SaaS product and want to implement this kind of AI-powered product intelligence system as part of a broader custom AI development engagement, the AI Architects community is where we share frameworks, tooling decisions, and implementation walkthroughs with founders who are building in public.